A report by city council chief executive Karime Hassan on an Exeter greenhouse gas emissions inventory by the University of Exeter has disregarded hundreds of thousands of tonnes of emissions that are driven every year by the actions of the city’s residents, businesses and visitors.
The council-commissioned study also confirmed that Exeter emissions reductions to date have resulted largely from national electricity grid supply changes and not the actions of the city or county councils.
It found that Exeter is overshooting emissions targets for transport by 400% and buildings by 600%, and that much greater reductions are immediately required which will nevertheless see the city continue to generate millions of tonnes of greenhouse gas emissions.
The study specifies actions that would address the territorial emissions for which it accounts. But it does not account for the emissions that will result from the additional 12,000 homes that the council wants to build which will increase Exeter’s population by around 22% over the next twenty years.
Nor does it account for emissions that are imported by Exeter’s residents, businesses and visitors which are likely to be much higher than its territorial emissions.
This omission is not the result of ignorance: the council also commissioned a greenhouse gas emissions inventory from the same University of Exeter team to use in its own corporate carbon reporting which includes the emissions that were excluded from the city-wide inventory.
More than two-thirds of the city council’s corporate emissions occur under this emissions scope.
 University of Exeter Centre for Energy and the Environment Exeter greenhouse gas inventory. Source: source.
There are several approaches to greenhouse gas emissions accounting in use. Each yields different estimates using different methodologies based on different data sets. Efforts to improve their accuracy are ongoing.
The UK government uses three principal official measures to fulfil a range of international agreements and for domestic policy-making purposes.
BEIS territorial estimates include emissions produced within the UK’s borders while ONS residence estimates cover emissions by UK residents and UK-registered businesses whether in the UK or overseas. DEFRA carbon footprint estimates account for the emissions of all goods and services consumed in the UK wherever they are produced in the world.
A comprehensive (and globally just) approach to calculating the greenhouse gas emissions of a given population or geography requires the use of a methodology which accounts not only for emissions produced within that territory but also emissions that are imported, as well as exported.
The DEFRA carbon footprint estimates follow this approach. They account for emissions in the places where goods and services are consumed, rather than the (usually many) places that respond to that demand by supplying the goods or services in which emissions are embedded.
As a result DEFRA carbon footprint estimates yield much higher figures for the emissions for which the UK is responsible than the BEIS territorial estimates, which produce the lowest.
In 2016 the ONS estimated that 40% of the UK’s carbon footprint related to imported emissions while DEFRA found the proportion was 43% in 2019 and has since revised this upwards to nearly 48% in its most recent estimates, the methodology for which it now considers fully developed.
As the DEFRA carbon footprint estimates are calculated for the whole country it is only possible to use them for smaller geographies on a broad per capita basis. Doing so yields an annual carbon footprint for Exeter of around 1.5 million tCO2e in 2019, the most recent year for which these figures are available.
(To ensure they are reported on a consistent basis, greenhouse gas emissions are measured in tonnes of carbon dioxide equivalent - tCO2e - where each of the seven main greenhouse gases are weighted by their global warming potential.)
This is about equal to the figure of 11.6 tCO2e per person per annum for Exeter that Exeter City Futures promoted last year (and well over a million tonnes a year more than the total of all projected carbon savings from the actions proposed by the company’s Net Zero Exeter plan).
Calculating Exeter’s emissions using the 2019 BEIS territorial emissions estimates on the same broad per capita basis as the DEFRA figures yields a much lower annual carbon footprint for the city of around 900,000 tCO2e.
However the distribution of territorial emissions around the UK differs widely. Small cities with low levels of carbon-intensive industrial and goods production activity, such as Exeter, are responsible for a much lower proportion of UK terrestrial emissions per capita than cities such as Swansea or Coventry which produce steel and cars for domestic use as well as export.
Wealthy cities also typically import a higher proportion of their emissions than poorer cities because their residents have greater disposable incomes with which to buy goods and services that are typically produced elsewhere.
As a result Exeter’s terrestrial emissions will be lower than the BEIS per capita UK average, while the proportion of its imported consumption emissions will be higher than the DEFRA per capita UK average.
How much lower? After updating its methodology this year to include methane and nitrous oxide (but not fluorinated gases) in its local authority estimates BEIS said Exeter’s territorial greenhouse gas emissions were 488,000 tCO2e in 2019. Fluorinated gases would add around 29,000 tCO2e to make a total of around 517,000 tCO2e.
How much higher? The DEFRA estimates for 2019 found that nearly 81% of the UK’s consumption emissions were accounted for by goods and services produced both in the UK and abroad.
Unfortunately, calculating an accurate consumption-based carbon footprint for a sub-national geography such as Exeter using the approach which produced the DEFRA figures is not possible as it relies on national trade data, expressed in financial terms, to link flows of goods and services with the emissions generated by their production and distribution.
So while we can be sure that Exeter produces some of the goods and services it consumes, we cannot be sure how much. As a result we can only use the DEFRA estimates to conclude that the proportion of the city’s consumption-driven greenhouse gas emissions which it imports in the form of goods and services could be as much as three quarters or more of the total.
Nor are the BEIS terrestrial estimates directly comparable with the DEFRA consumption estimates. Exeter’s imported emissions cannot simply be added to its terrestrial emissions as this would not address emissions from the production of goods and services in the city that are exported for consumption elsewhere, among other issues.
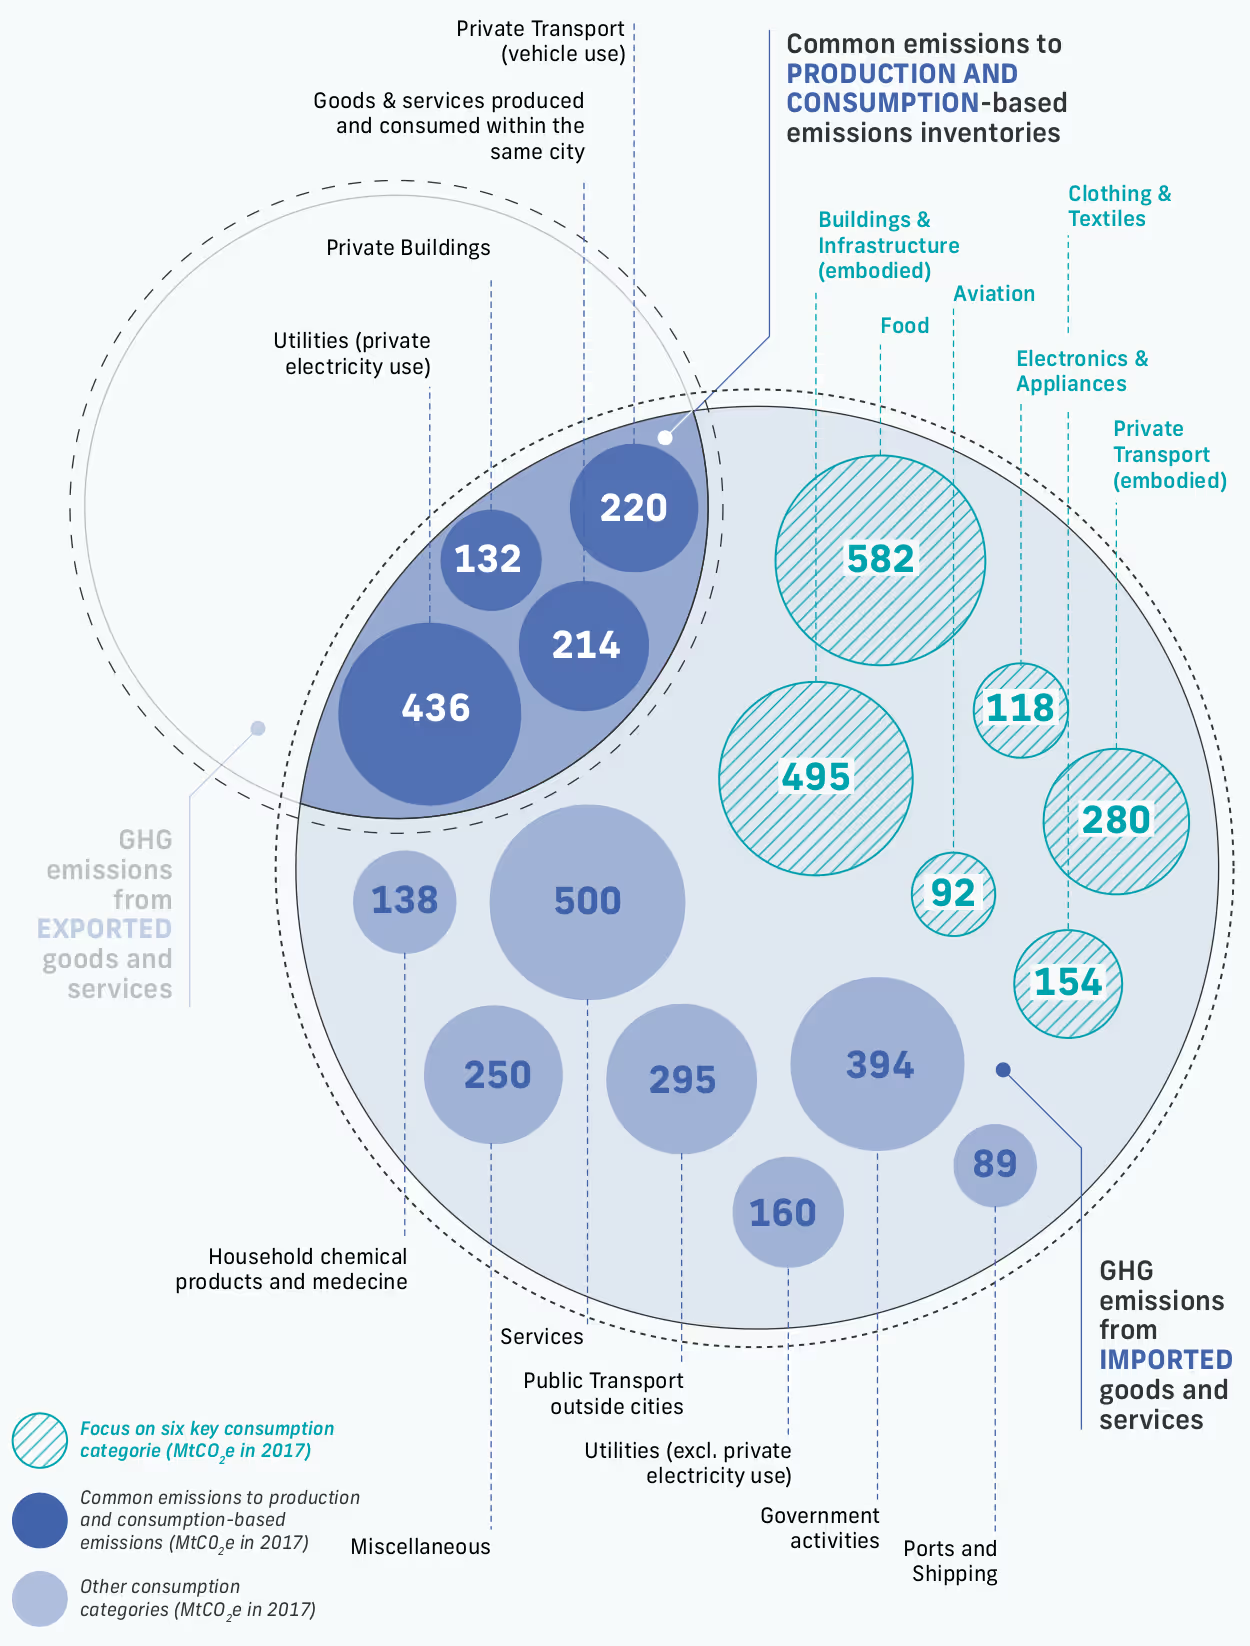 Production vs consumption based emissions by category from The Future Of Urban Consumption in a 1.5°C World, University of Leeds, ARUP & C40 Cities
However another approach is available which has developed from a method used for calculating corporate and organisational emissions which is the world’s most widely-used greenhouse gas accounting standard: the Greenhouse Gas Protocol.
The Global Protocol for Community-Scale Greenhouse Gas Inventories provides a robust methodology for community-scale carbon emission measurement.
This methodology, also known as the Greenhouse Gas Protocol for Cities, divides emissions into three “scopes” and provides several reporting frameworks, the most comprehensive of which aligns with the IPCC national emissions reporting guidelines.
Scope one covers emissions from sources inside the city boundary, scope two covers emissions resulting from the use of grid-supplied energy inside the city boundary and scope three covers all other emissions that occur outside the city boundary as a result of activities that take place within it.
Emissions from the production of goods and services which are exported are accounted for in scope three of the place where they are consumed.
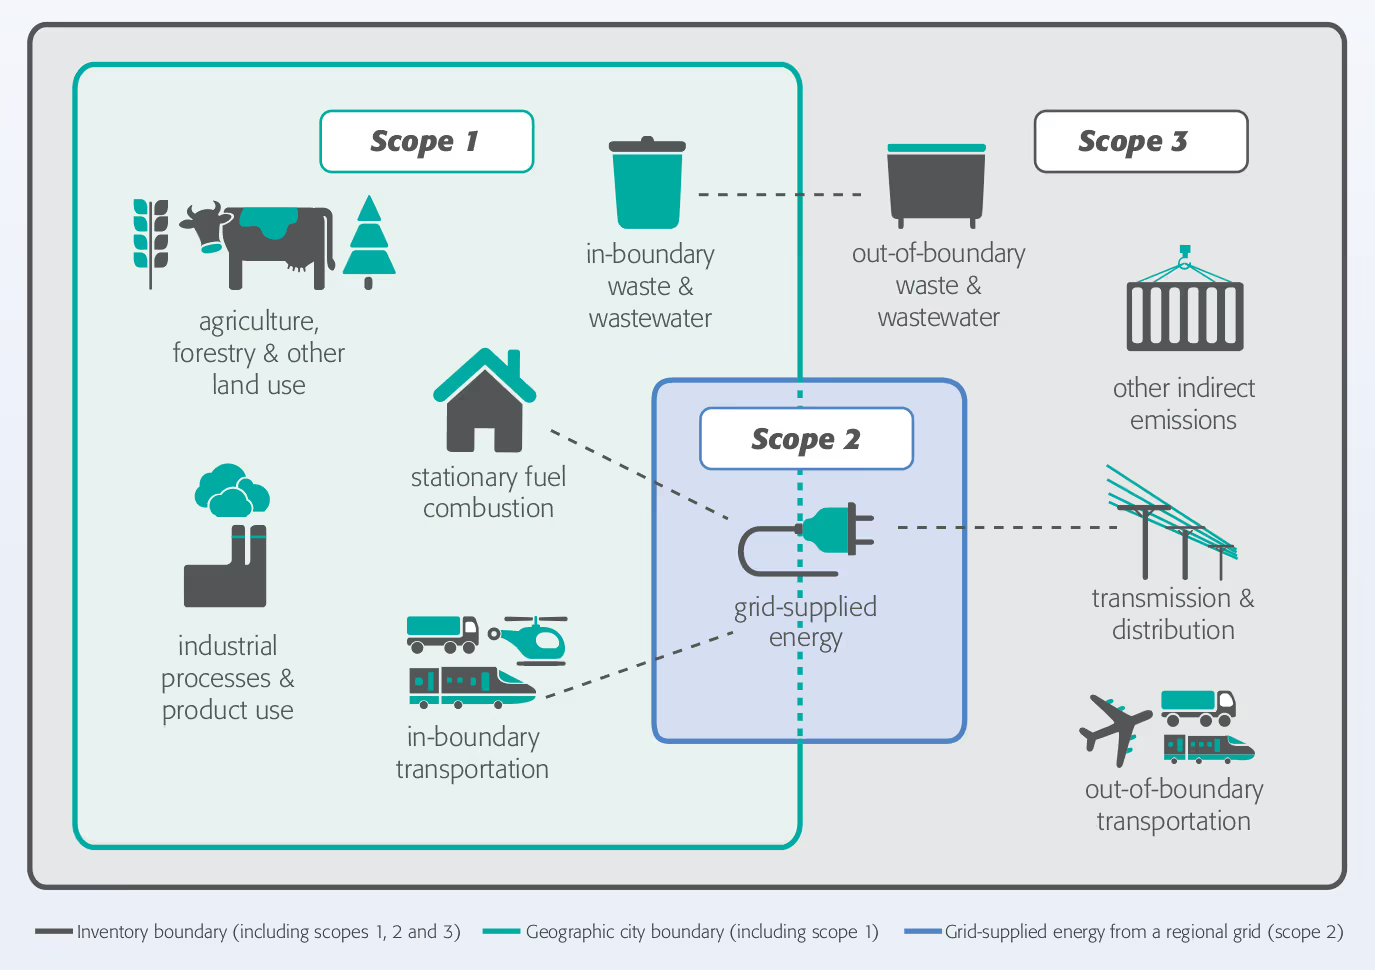 Greenhouse Gas Protocol for Cities – sources and boundaries of city greenhouse gas emissions
This methodology is the basis of the approach used by the University of Exeter Centre for Energy and the Environment to calculate emissions inventories for the members of a partnership of South West local authorities called the South West Energy and Environment Group (SWEEG).
Exeter City Council and Devon County Council are both members: the Devon County Council-led Devon Climate Emergency project also relies on SWEEG inventories for the greenhouse gas emissions figures it uses as the basis for the Devon Carbon Plan (which it misleadingly calls “carbon footprints” on its website).
However SWEEG emissions inventories do not fully adhere to the Greenhouse Gas Protocol for Cities methodology.
A SWEEG methodology paper, which explains some of the differences, was supposed to accompany the Exeter greenhouse gas emissions inventory but the city council chief executive did not include it in his report.
 University of Exeter Centre For Climate and the Environment greenhouse gas inventories for SWEEG methodology paper
Instead of estimating emissions using bottom-up calculations based on the activities of people in a particular geography, which is the approach specified in the Greenhouse Gas Protocol for Cities methodology, SWEEG emissions inventories rely on BEIS local authority level emissions estimates for their inventory calculations to make them cheaper to produce.
BEIS publishes these estimates two years in arrears so the Exeter inventory, the first draft of which was produced in 2021, was calculated on the basis of figures from 2019. These BEIS estimates only accounted for carbon dioxide emissions, so the university team used these as a basis on which to estimate other greenhouse gas emissions for that year.
As the BEIS estimates entirely omit some sectors and gases the university also used other data as well as proxy sources to fill in some of the other gaps.
Like the BEIS territorial emissions estimates on which they are based, SWEEG methodology estimates only cover greenhouse gas emissions in scopes one and two.
(It is unclear whether the city council chief executive understands this: when asked by Green Party councillor Tess Read to clarify which emissions scopes were included in the Exeter inventory, he incorrectly replied that it only covered scope one).
The city council claims this is because such emissions are “more in the control of people living, working and visiting the city”. However Exeter scope three emissions are also driven by the actions of people living in, working in and visiting the city, many of which are entirely in their control.
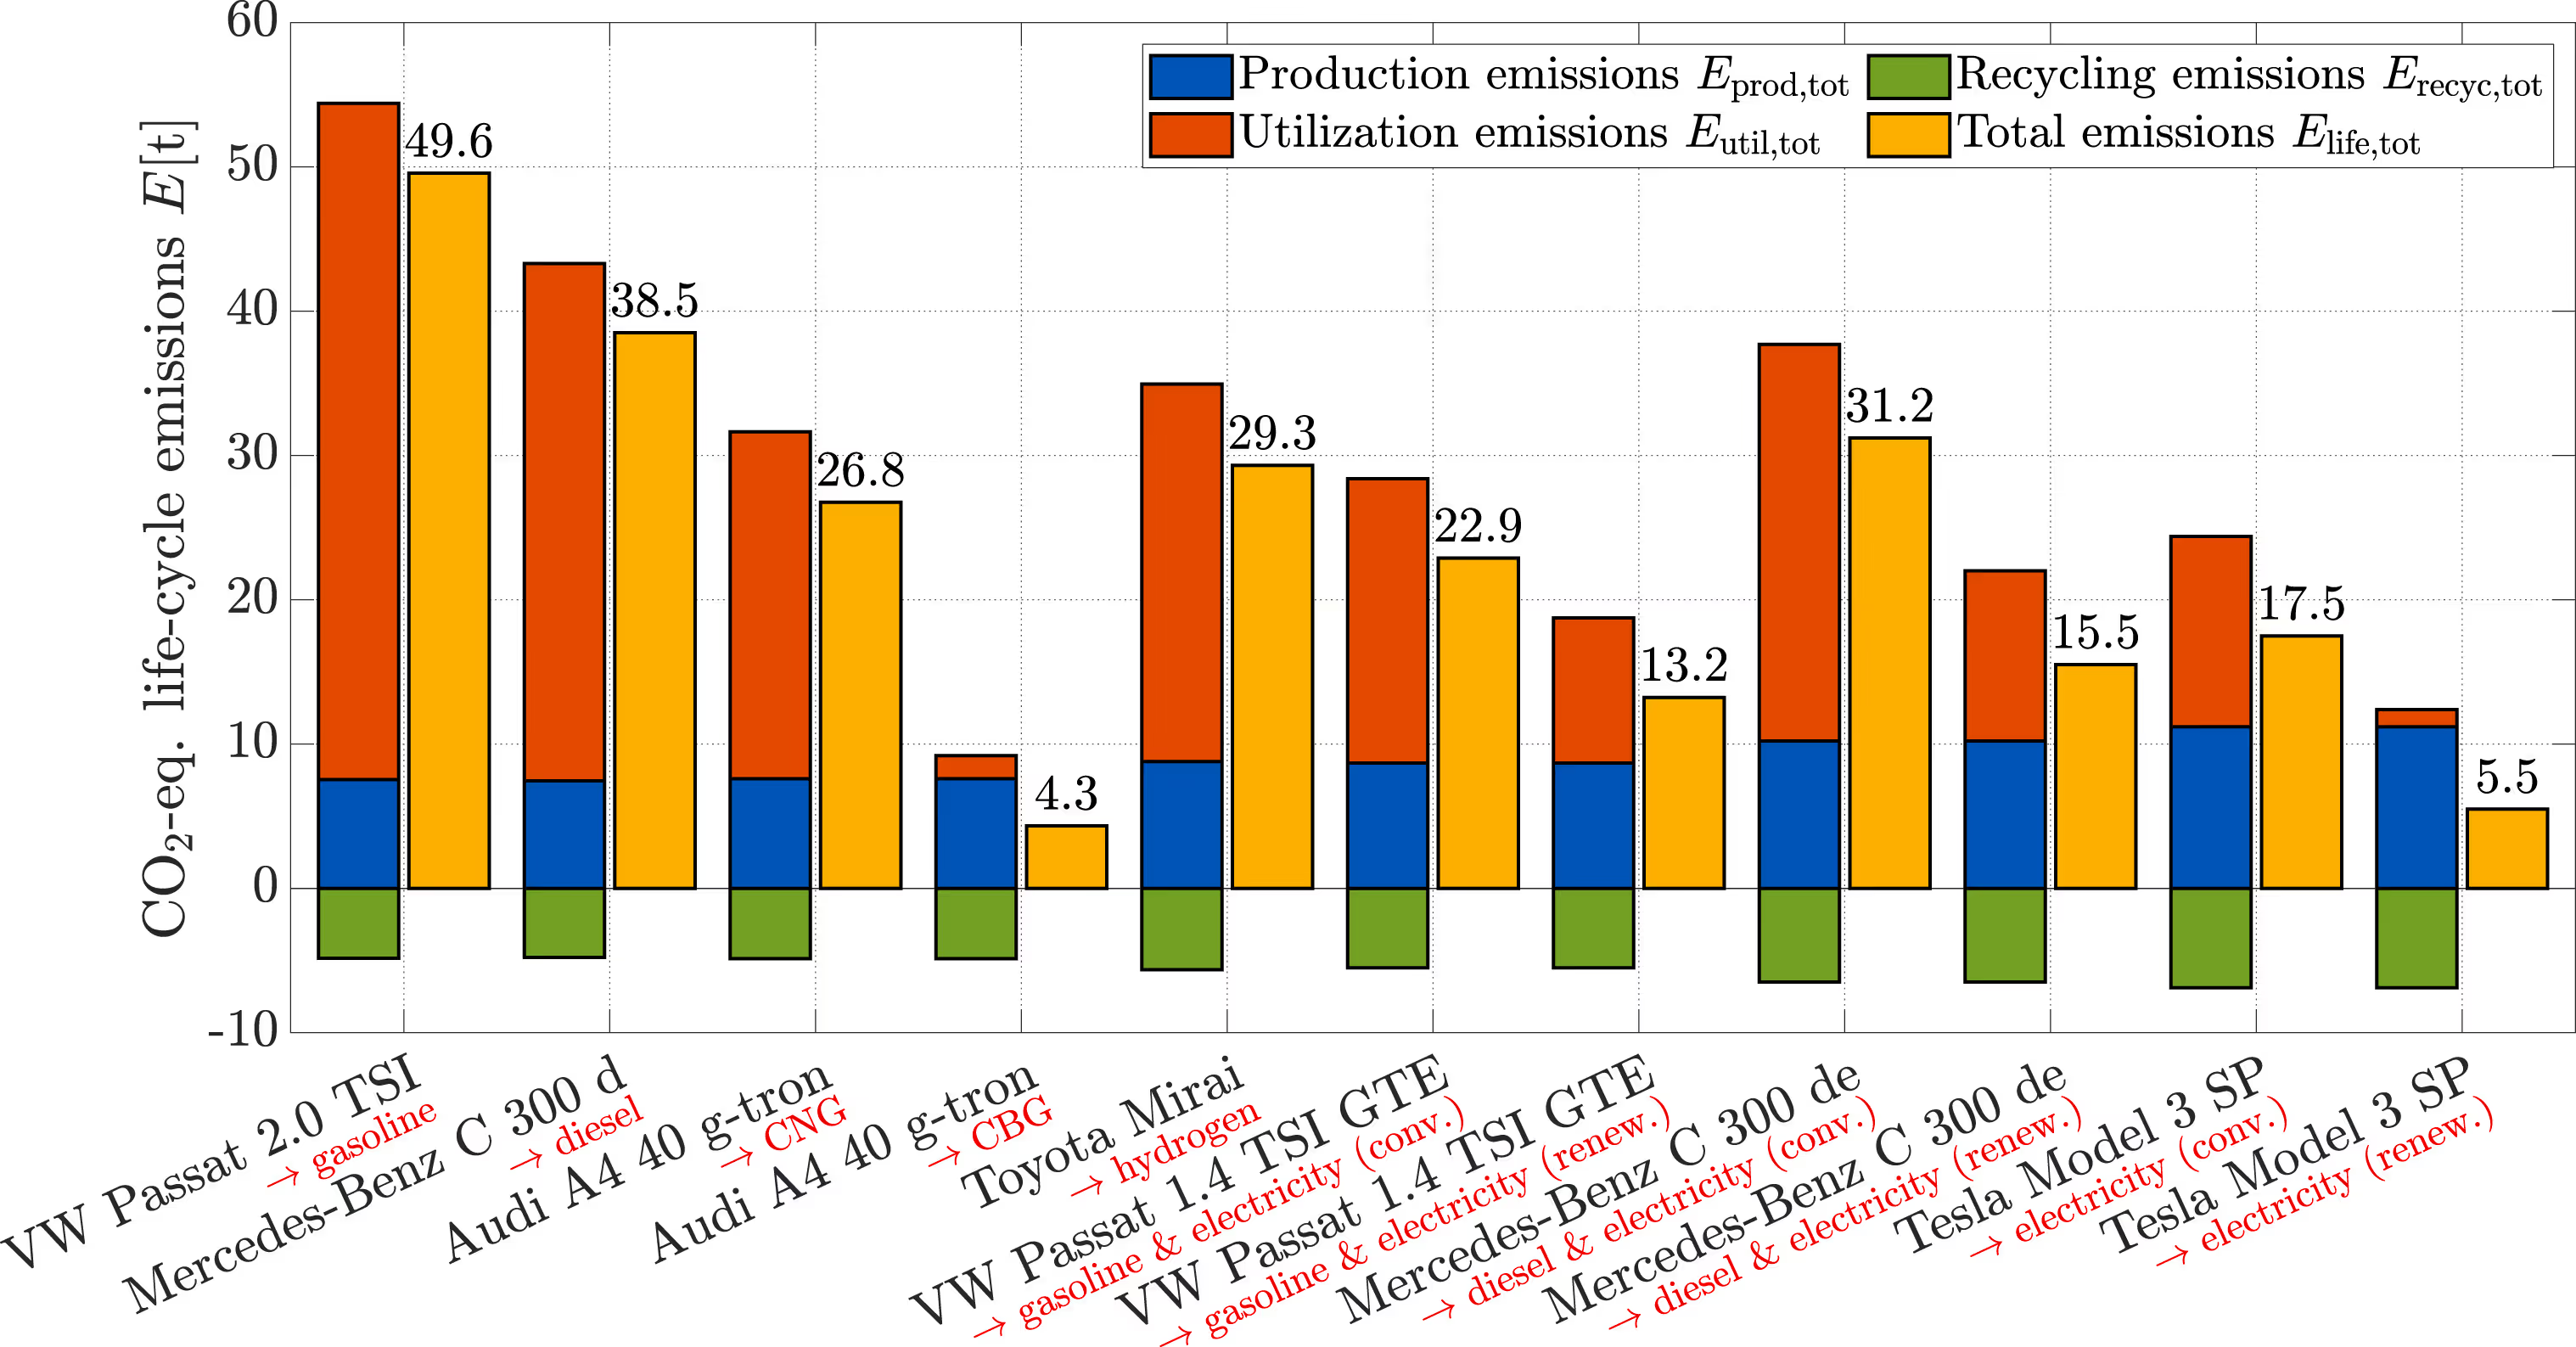 Total life-cycle greenhouse gas emissions of a range of passenger cars. Source: Renewable and Sustainable Energy Reviews under Creative Commons license.
The Greenhouse Gas Protocol for Cities accounts for the emissions from fossil fuel burned by combustion engine-powered vehicles driven inside cities in scope one, but accounts for emissions generated in the discovery, extraction, refinement and transportation of the fuel in scope three (at least until the tanker carrying it enters the city).
The emissions generated by the production of the car, including those embedded in the materials from which it is made as well as its disposal at the end of its life, all also fall in scope three unless any of those processes take place in the city.
These emissions can be considerable, even for battery-powered electric cars.
The situation with buildings is similar. The Greenhouse Gas Protocol for Cities accounts for emissions from fossil fuel burned in space and water heating and cooking in scope two, as it does those generated by the use of non-renewable electricity, when the energy is supplied via the distribution grid.
However emissions which are embodied in the materials from which buildings are constructed and the emissions generated in their construction and demolition are accounted for in scope three, unless they are produced or disposed of in the same place they are used, while the emissions from energy required for these processes is only covered in scopes one and two to the extent it is consumed there.
In the UK these emissions are greater than the emissions from the shipping and aviation sectors combined, while demolition often entails a much higher carbon footprint than re-use no matter how energy efficient the replacement structure.
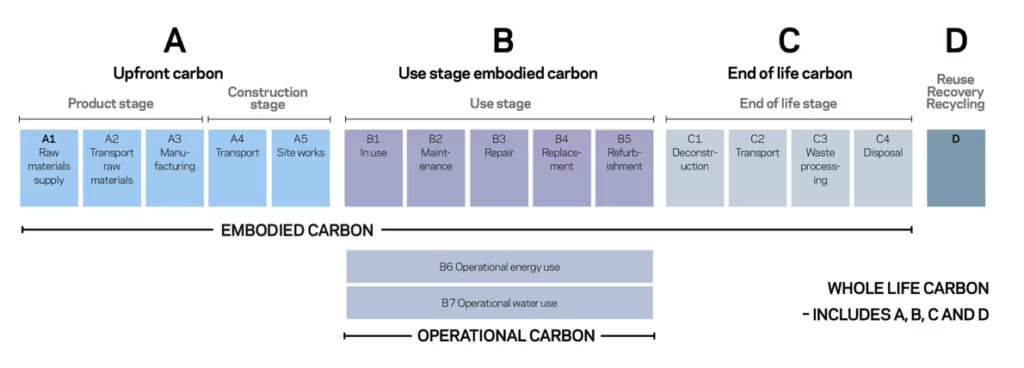 Construction carbon life-cycle. Image: University of Liverpool Zero Carbon Research Institute.
There is no mention of scope three emissions related to transport and buildings in the city council chief executive’s report, nor any mention of emissions scopes at all.
The university study refers just once to consumption-based carbon footprint measurement methods, in a footnote. But it neither explains the differences between this approach and the SWEEG methodology, nor the differences between the SWEEG methodology and the Greenhouse Gas Protocol for Cities reporting framework on which it is based.
Nor does it explain that the council’s decision to restrict the scope of the study to territorial emissions produces partial decarbonisation targets which do not address Exeter’s imported scope three emissions, or mention that these could easily be at least as large again as the territorial emissions it covers.
It does say that the SWEEG methodology “is consistent with the approach taken in UK national reporting”, which currently uses BEIS territorial estimates, but also makes clear that it relies throughout on the decarbonisation targets set in the UK’s national Sixth Carbon Budget.
These targets include international shipping and aviation emissions which are largely accounted for in scope three.
The SWEEG methodology also excludes shipping emissions even where they occur inside the city boundary.
Exeter City Council is responsible for both the River Exe and Exeter Ship Canal to one mile out at sea, but the SWEEG methodology excludes emissions from these sources because of uncertainty about the data.
And it excludes emissions from Exeter Airport, even for domestic flights, on the grounds that “there are questions as to where the boundary should be set for such emissions”.
The Centre for Energy and the Environment team estimated that annual emissions from Exeter Airport passenger flights alone amounted to 173,000 tCO2e in 2017, then in 2020 estimated the airport’s total flight emissions to be around 200,000 tCO2e each year.
Meanwhile the UK’s food supply generates more emissions abroad than it does at home, and it imports significant proportions of the cars and lorries, electrical and electronic devices, clothing and shoes, furniture and luggage, pharmaceuticals and cosmetics, toys, jewellery and other goods that fuel its consumer economy.
The SWEEG methodology excludes all the scope three emissions related to these goods, as it does the scope three emissions related to the provision of a wide range of commercial and consumer services ranging from corporate accounting software to streaming entertainment platforms.
 Tweet promoting Exeter Airport flights and parking by city council chief executive Karime Hassan with comments from Met Office & University of Exeter climate scientists
While greenhouse gas emissions inventories are simpler to calculate for organisations than cities, population-level emissions are not necessarily more difficult to estimate in scope three than in scopes one and two.
Such estimates are inevitably imprecise, even in scopes one and two, not only because of challenges with accessibility to data and the scale and complexity of human settlements but also because of variations in methodology.
The university team recently evaluated the differences between its SWEEG methodology and a bottom-up calculation which faithfully followed the Greenhouse Gas Protocol for Cities methodology while producing an inventory commissioned by Cornwall Council.
It found that its results differed by only a few per cent for most stationary combustion sources but varied by as much as 20% for on-road transportation emissions. These were lower when based on BEIS data (as per the SWEEG methodology) than they were when based on fuel sales (as per the Greenhouse Gas Protocol for Cities methodology).
Methodological challenges no more provide a justification for excluding scope three emissions from population-level greenhouse gas emissions estimates than they do for excluding scopes one or two. Especially in a city which likes to boast that it “houses more of the world’s top 100 climate scientists than anywhere else” and claims to aspire to global climate leadership.
Nor do they mean we should allow the perfect to be the enemy of the good by excluding imprecise estimates from policy- and decision-making, especially when considering issues that will take decades to address and have existential import.
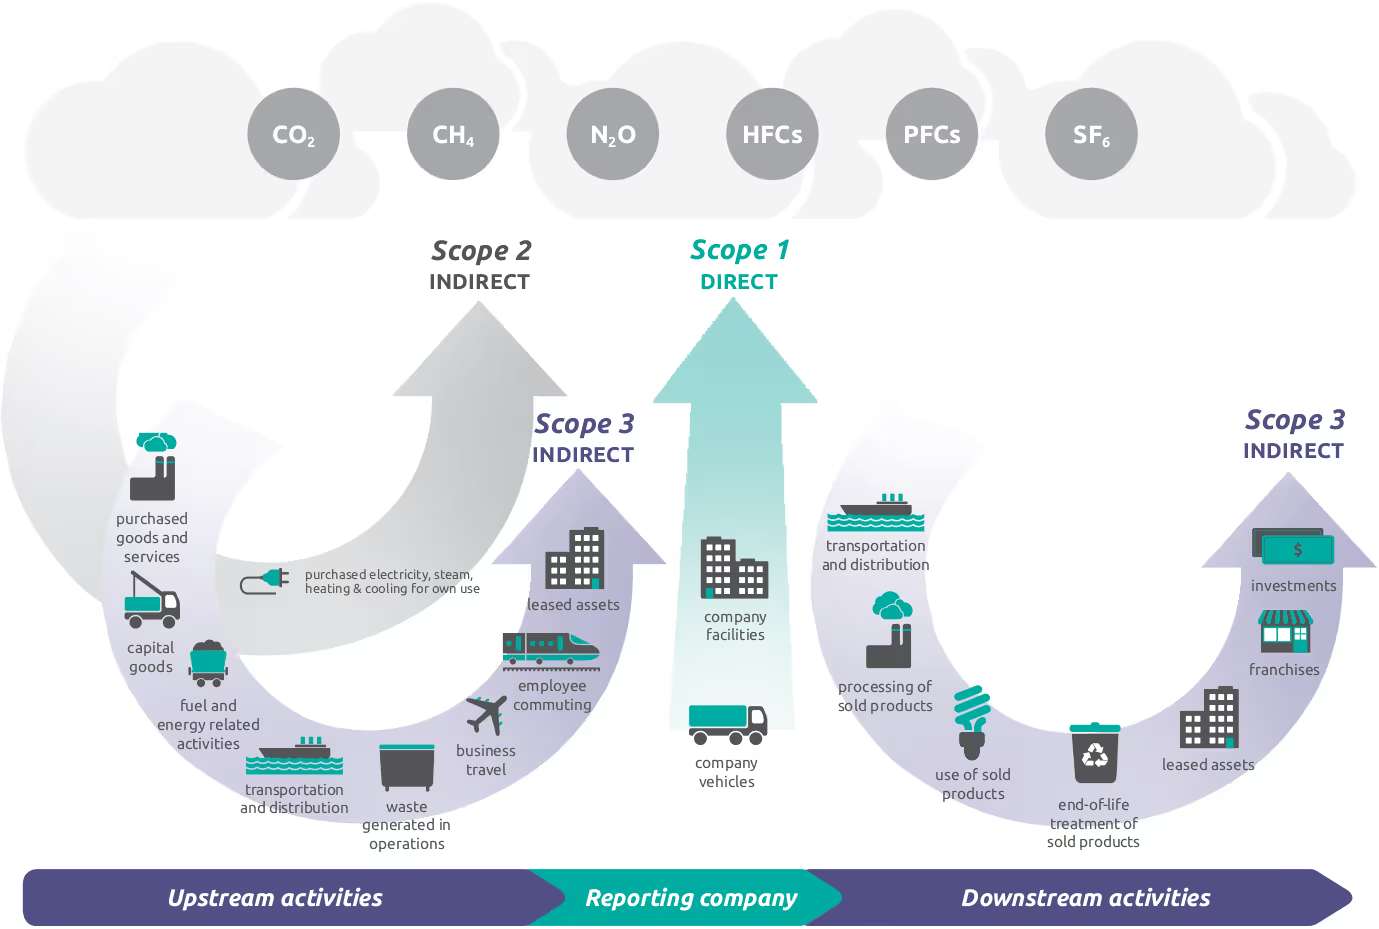 Greenhouse Gas Protocol Corporate Value Chain Standard – scopes and emissions
Excluding scope three emissions from scopes-based emissions estimates isn’t only globally unjust, its methodological incoherence also produces perverse consequences at home.
In the same way as Swansea should not alone shoulder the emissions burden from its steel industry or Coventry its car manufacturing, the residents of Cranbrook, its nearest settlement, can hardly be expected to take responsibility for the emissions generated by Exeter Airport.
Yet the county council’s Devon Carbon Plan and the city council’s Exeter greenhouse gas inventory nevertheless both fail to account for them, ducking the issue of who should take responsibility for them.
Disregarding hundreds of thousands of tonnes of annual emissions doesn’t just misrepresent the scale of Exeter’s impact: it produces partial decarbonisation targets which guarantees the city will fail to reach net zero by 2030.
Worse still, it ignores the potential Exeter does have to reduce imported emissions, many of which are driven by consumption choices made by residents, businesses and visitors every day.
There is low hanging as well as much harder to reach fruit in all emissions scopes. To disregard scope three is to ignore numerous opportunities to reduce our imported emissions whether or not government policy is to account for them.
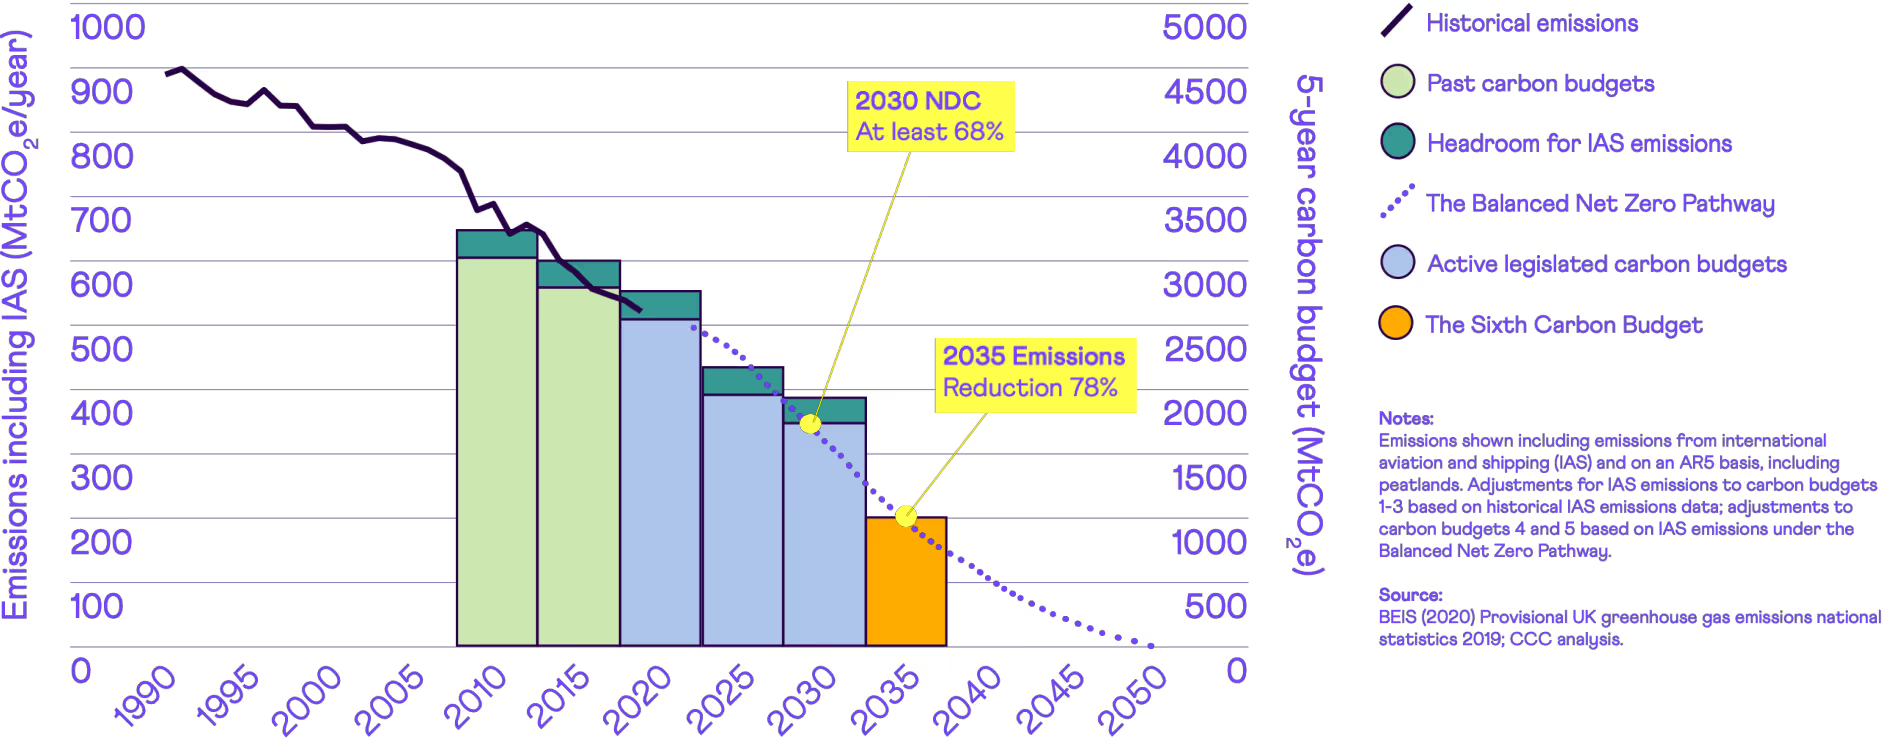 Climate Change Committee Sixth Carbon Budget – recommended path
And government policy is likely to move towards doing so, notwithstanding the scorched earth positions of several current Conservative Party leadership candidates.
In its recent report to Parliament the UK’s statutory Climate Change Committee said: “Domestic decarbonisation should not lead to carbon leakage, but rather reduce both consumption and territorial emissions”.
It also said: “We recommend that the UK aims to reduce its overseas consumption footprint as part of its contribution to reducing global emissions.”
The committee isn’t expressing naive optimism about the direction of travel. Since the UK government’s claim to have set the “world’s most ambitious climate change target” by including international shipping and aviation in its carbon budget other countries have gone much further.
Sweden has announced that it will include comprehensive consumption-based emissions in its national climate targets, which are to reach net zero by 2045, five years earlier than the UK.
And Finland has set the world’s most ambitious climate target: to reach net zero by 2035 and net negative emissions (without relying on international offsetting) by 2040.
Meanwhile Somerset West and Taunton is pursuing a climate action plan which demonstrates that there is no reason for Exeter’s professed climate leadership ambitions to be held back by the UK government’s failure to keep up with the decarbonisation plans of other countries (let alone deliver on its own).
Its Carbon Neutrality and Climate Resilience Action Plan, which it prepared more than two years ago, includes a complete population-level baseline inventory which adheres to the Greenhouse Gas Protocol standards and covers all emissions scopes.
As it says: “Solely considering the carbon emissions produced in the district does not accurately reflect total greenhouse gas emissions arising from activity within the district.
“The goods and services which we consume here are often produced elsewhere, and vice versa. Emissions relating to these supply and value chains are particularly important to recognise as our behaviours drive these emissions even if we don’t produce them directly ourselves.”
No doubt Exeter City Council’s executive would say that a Labour government would deliver decarbonisation where the Conservative government is failing to do so.
It could take a step in that direction by including scope three emissions in the city’s greenhouse gas reduction targets and come clean on the scale of change that is actually needed to get anywhere near net zero at all.